
When you are trying to troubleshoot issues surrounding apps and their processes on a Mac, your first stop should be the Activity Monitor. Just as Windows users visit the Task Manager to check out process activity on their systems, OS X users can head over to the Activity Monitor in order to view information about running processes and potentially diagnose issues with the apps they are using.
The Activity Monitor
To access the utility, open a Spotlight window, type Activity Monitor and launch it. You can also find the tool in the Utilities section of the Applications menu. The utility’s main window will instantly show you information about the currently running processes. The menu will list items from any app running at that time as well as various system processes which should be left alone. The quickest way to understand which processes are system ones is by looking at the User column. All “root” processes are important to the system, though there are also “Username” processes which are equally important.
By default, Activity Monitor updates its statistics every five seconds. To change that, go to View > Update Frequency and choose another time interval. The utility always opens at the CPU section but every system monitoring tab is important for our cause. We will take a look at all the individual tabs so continue below to see how you can use them to your advantage.
CPU
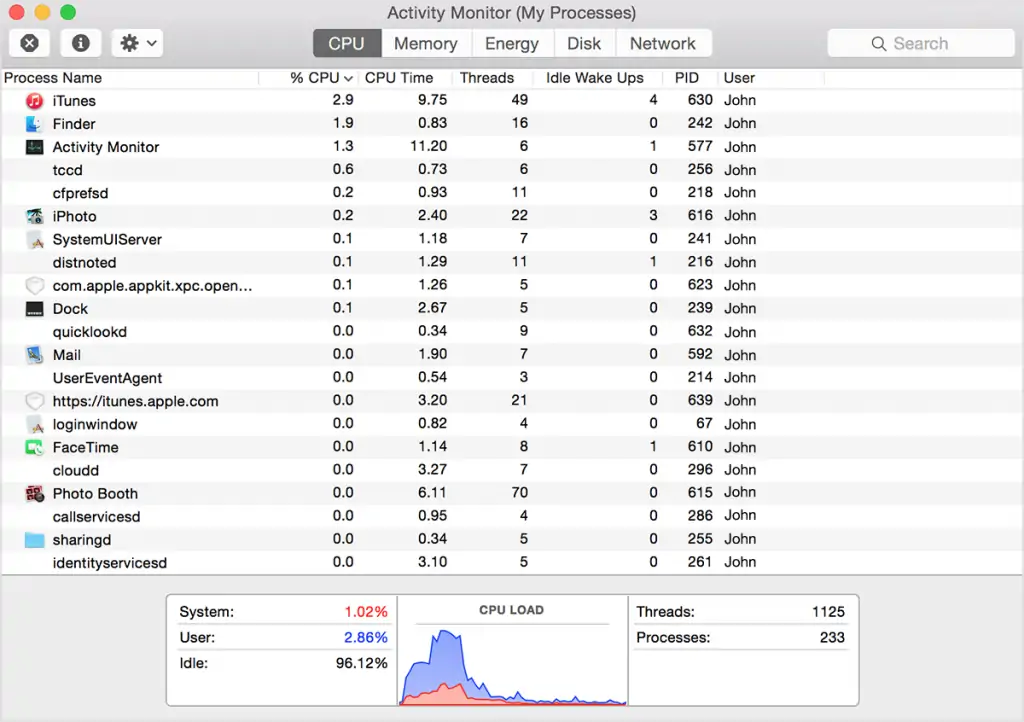
This tab describes exactly how your active processes are using your Mac’s processor or CPU. The most important column is the percentage one as this allows you to instantly check if an app is using more resources than it should be. The bottom of the tab also provides a quick way to check out how much of your CPU is being used by System and User processes. The “Idle” section shows how much of your CPU is being left alone so the number should be very high when you are not actively engaged in an app.
With that said, high CPU usage does not necessarily spell out trouble for your system. Resource-heavy applications are particularly noteworthy as you will likely notice their CPU usage fluctuating all the time. Watching videos on the Internet, for instance, will make your browser use a much higher percentage of your CPU until said videos are over. The CPU usage of some system processes will also appear to spike occasionally but that is also perfectly normal.
Clicking on the “% CPU” column will list the process from high to low CPU usage so you can easily confirm when an app is using more resources than normal. Should an app misbehave like that, you can easily shut it down by selecting it from the menu and clicking on the “X” button from the toolbar at the top. Remember to leave “root” processes alone, however, as you may damage your system.
Memory
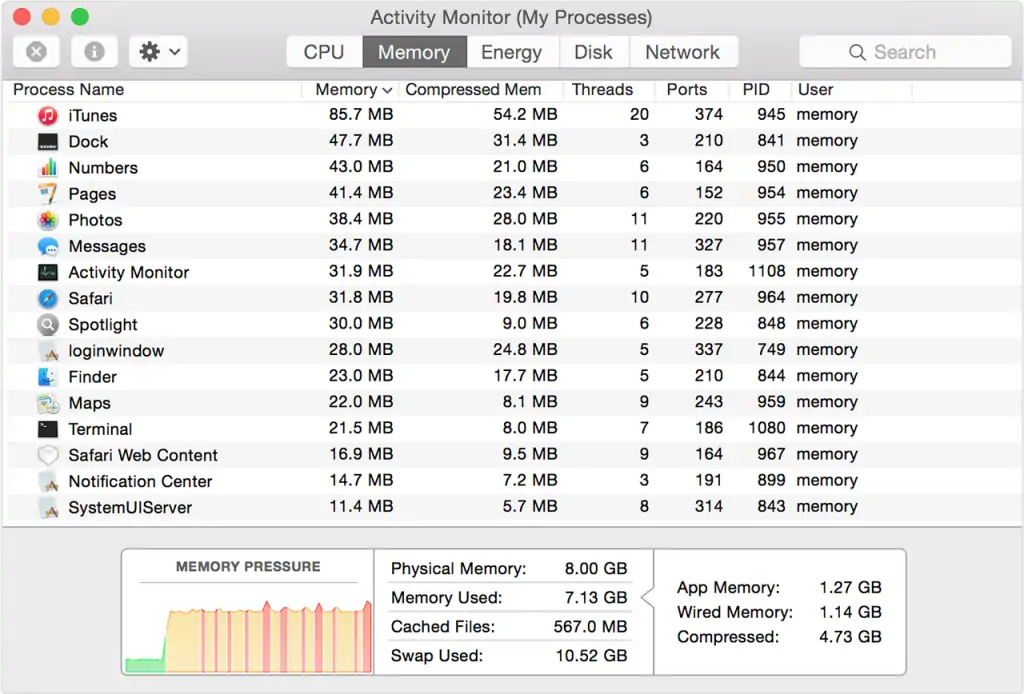
The Memory panel informs you about RAM usage. Apps that consume a high percentage of your CPU will most likely consume high percentages of your memory as well though that is not always the case. What you should be most interested in here are the “Memory Used”, “Cache”, and “Swap Used” sections at the bottom. Memory Used simply tells you how much of your RAM is actively being used by the processes. This section is further divided into “App Memory”, “Wired Memory”, and “Compressed”. Wired Memory usually refers to how much of your RAM is reserved for important system processes whereas the Compressed part denotes a percentage of your RAM that OS X might not be using at that exact point.
The Cache refers to RAM that your computer reserves for all processes. Basically, part of your RAM is reserved for processes you have already ran so that the system can launch them quicker the next time. But when another process needs more RAM, it can easily grab more from the cache.
In addition to that, the Swap Used field details the amount of space used on your startup drive by the Mac’s memory management systems. Low amounts of usage are acceptable but high numbers may indicate that your Mac does not have enough RAM to deal with the apps you are running.
The “Memory Pressure” section is also quite important. As long as the color stays green, your Mac’s memory usage is usually fine and there is nothing to worry about. When that color turns red, however, OS X basically tells you that your computer does not have enough memory to run everything. When that happens, your Mac will start using a part of your hard drive instead of your RAM. The most unfortunate side effect of this is that processes will run much slower on a hard drive.
Energy
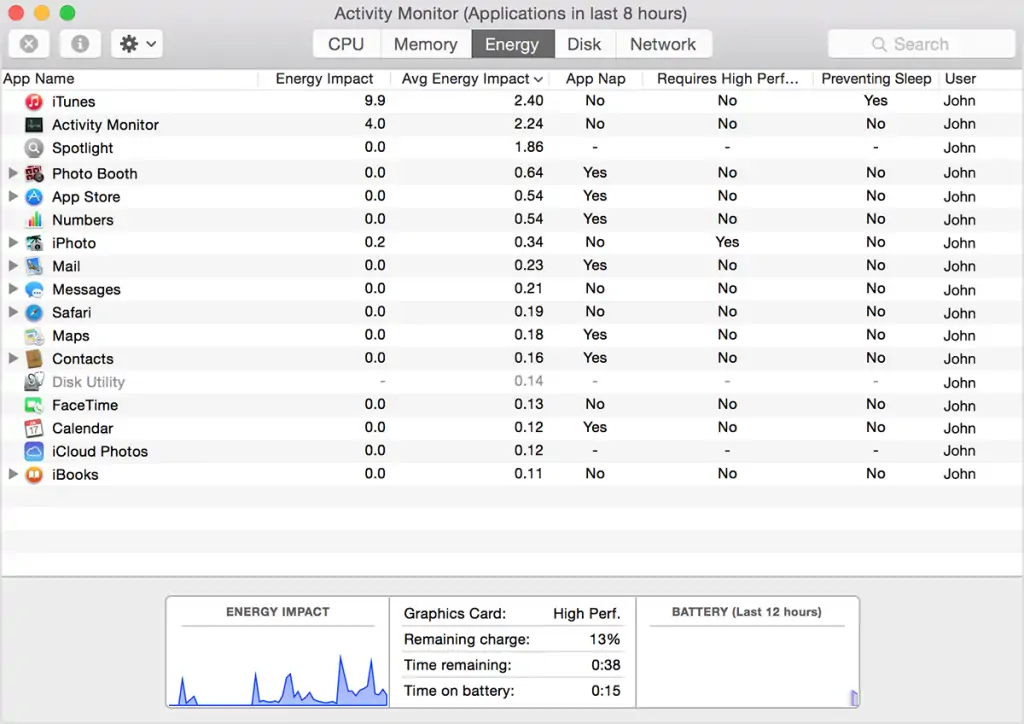
A very important tab for people who are always on the go as this section details just how much of your battery is being used by the processes. Clicking on the “Avg Energy Impact” column is a great way to see which apps are the greatest battery hogs so you can deal with them accordingly. If you are using any browser other than Safari, there is a pretty good chance it will appear high on the list. It is also worth noting that closing down individual tabs can instantly improve performance and reduce energy impact. To shut down individual tabs from this menu, click on the triangle icon next to an app, select a so-called “child process” and close it.
Disk
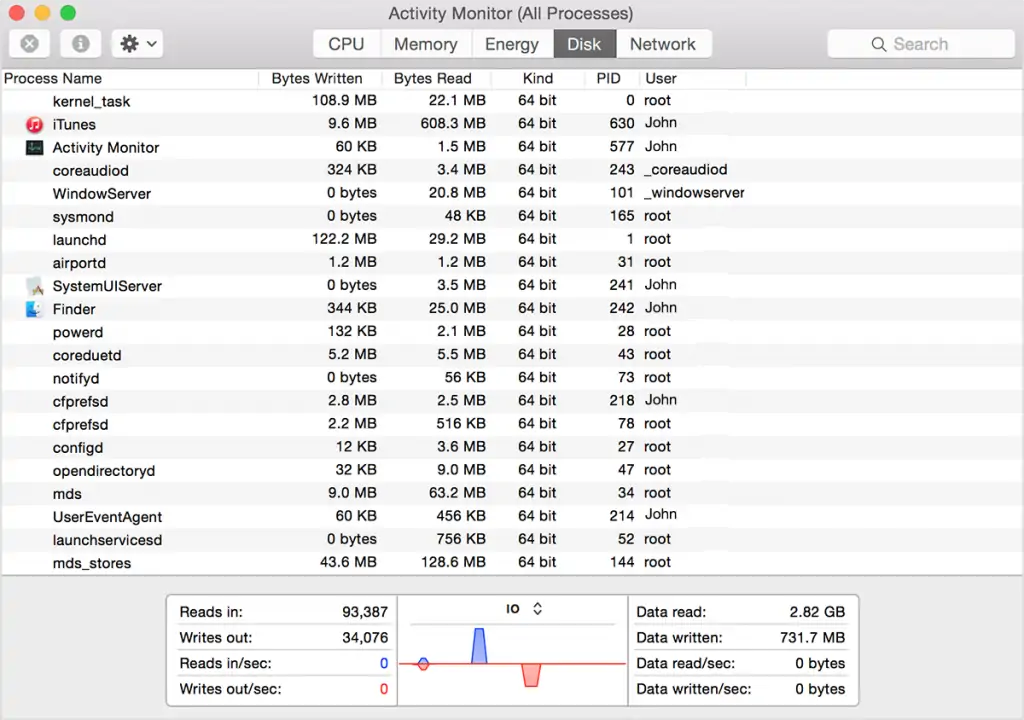
This section covers everything that happens in your hard drive. The values for each individual process are important in their own right but you will usually find that intensive processes take resources from every part of your Mac anyway. Looking at the “Data read/sec” and “Data written/sec” fields, users can quickly check if their drives are under a lot of pressure. Obviously, some activities in your Mac will result in very high disk usage numbers, especially during file transfers and multimedia conversions.
As I mentioned before, your system will automatically attempt to use your hard drive when it runs out of memory. Drives that still have a lot of available space will not be placed under much stress when this happens. When your hard drive is running out of space, however, your system will need to perform multiple functions at once in order to take advantage of the available space so you will definitely see drive usage spikes.
It is generally a good idea to have plenty of available space as you never know when your system is going to need it. When your Mac is running smoothly, this becomes less relevant as your hard drive will not be used for additional processes. With that said, some activities can be blocked when you are too low on hard drive space such as big software updates. If you have experienced any such problems, start deleting files immediately.
Network
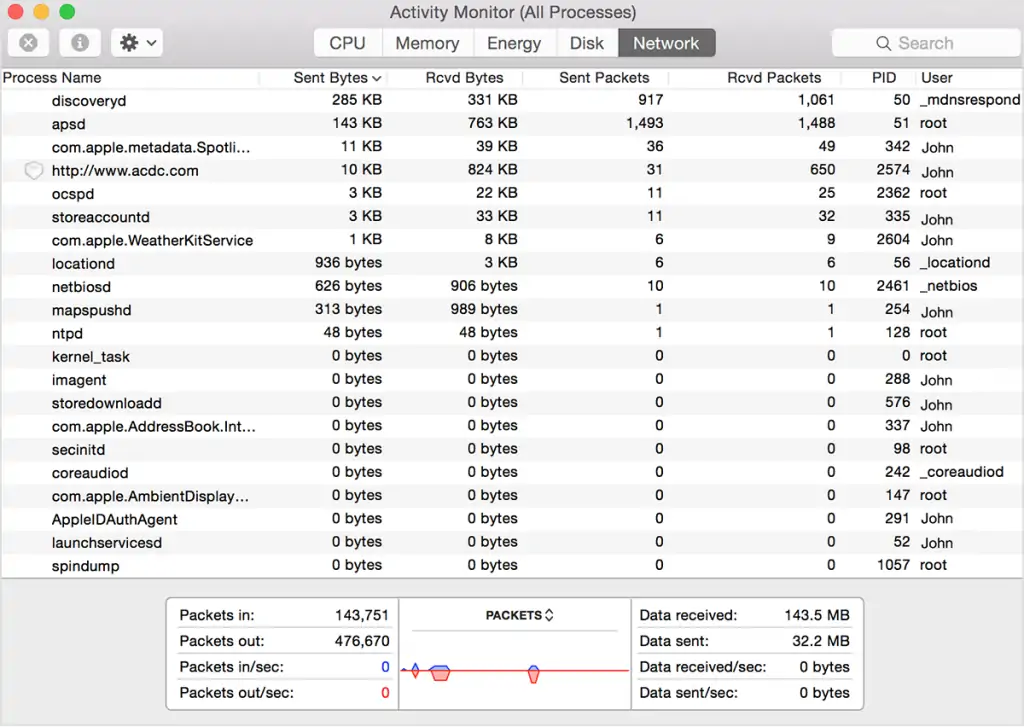
Just because you are not actively using your Mac, it does not mean it stops working. Background processes which are connected to the Internet are constantly downloading and uploading data so that they are always up-to-date. And while it is obvious for some applications like email clients, you may find dozens of unknown applications that continuously send and receive data even if you do not even know what they are doing.
The Network tab is a fantastic way to check which processes are connected to the Internet and how much of your data they are using. The top contenders will be applications like web browsers, email clients, online games, torrenting software, and more. While the results might not be surprising, checking the process is still vital for those who are on a limited data plan.


")

